This ELK stack is opensource stack, where E stands for Elastic serach, L– logstash and K stands for Kibana.
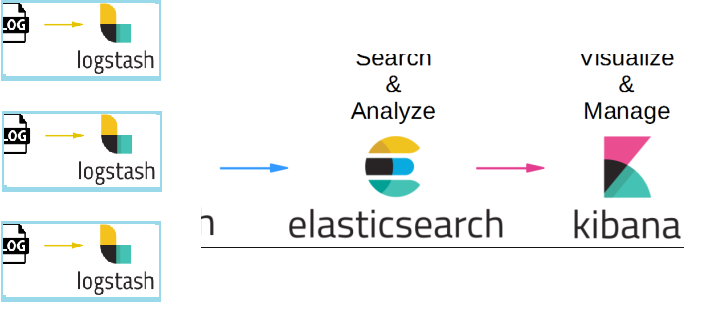
Below diagram will explain show this ELK stack is used in organization, with the help of logstash we can collect the data of any application put into elastic search and via elastic search same can be visualized at kibana desk board.

I hope from above diagram give you the better understanding how it work so let deep drive how to configure this stack, so that it will be help full to understand.

Before continuing to this post (Let me thanks to my friends or team member who explain me this in such a way I can configure this couple of hours at my server.) So let me share how I configure
Elastic Search Configuration:
Elastic Search:
Install elastic search:-
Download package from https://www.elastic.co/downloads/elasticsearch
If you want to run from anywhere in that case set the path in .bash_profile.
Start the elasticsearch ELK stacks
start the elastic search
./elastic_search shaktidevops@instance-4:~$ curlhttps://ssh.cloud.google.com/devshell/proxy?authuser=0&devshellProxyPath=%2F&port=9200" http://localhost:9200/
{ "name" : "MTe5Nrz",
"cluster_name" : "elasticsearch", "cluster_uuid"
: "1y_jQvBgS-SuB89nsSiyfw", "version" : {
"number" : "6.6.0", "build_flavor" :
"default", "build_type" : "tar",
"build_hash" : "a9861f4", "build_date" :
"2019-01-24T11:27:09.439740Z", "build_snapshot" : false,
"lucene_version" : "7.6.0",
"minimum_wire_compatibility_version" : "5.6.0",
"minimum_index_compatibility_version" : "5.0.0" },
"tagline" : "You Know, for Search"}
shaktidevops@instance-4:~$ curl http://localhost:9200/_cat/health?v
epoch timestamp cluster status node.total
node.data shards pri relo init unassign pending_tasks max_task_wait_time
active_shards_percent1549473193 17:13:13 elasticsearch green 1 1 0 0 0 0 0 0 - 100.0%shaktidevops@instance-4:~
$ curl http://localhost:9200/_cat/node?v
{"error":"Incorrect HTTP
method for uri [/_cat/node?v] and method [GET], allowed:
[POST]","status":405}shaktidevops@instance-4:~$ curl http://localhost:9200/_cat/nodes?vip
heap.percent ram.percent cpu load_1m load_5m load_15m node.role master
name127.0.0.1 10 49 1 0.00 0.00 0.00 mdi * MTe5Nrz
Elastic Search CURD operation please refer :
https://www.mysoftkey.com/category/nosql/elastic-search/
Use Case for ELK Elastic Logstash Kibana
- Fraud Detection
- Security Analysis
- Compliance
- E-commerce applicaiton for personalizatin of user events.
- Rist Management System
Happy learning 🙂